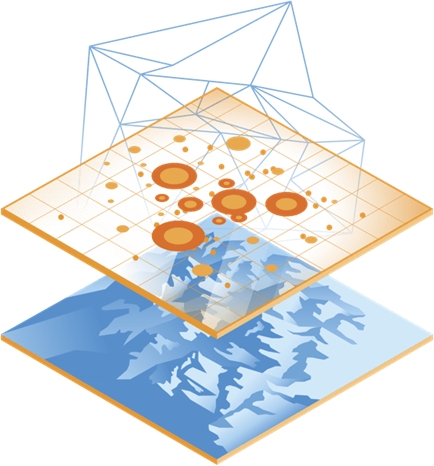
Advances in technology, low prices and availability of GPS devices resulted in overall presence of georeferenced data and heightened interest for spatial analysis. The goal of those analyses is describing spatial ordering of different processes (resources, pollution, biodiversity…) and modeling samples with that spatial structure. Modifying and linking a large number of statistical methods for analyzing and presentation of spatial data trough different software can be intimidating for new users. Main goal of this course is systematical introduction of spatial data analysis using case studies and hands-on approach that will enable students to analyze, visualize and interpret spatial data.
We chose open source system of R to demonstrate the analyses of spatial data because it ensures input, manipulation, analysis and presentation of spatial data in the same environment. Broad base of R users ensure quality and fast expansion of different functions (using packages) as well as tutorials and literature in different languages (predominately English).
- Nositelj kolegija: Toni Safner
- Nositelj kolegija: Dragica Šalamon
- Izvođač kolegija: Filip Varga
